前提
VSCodeがインストールされている
JupyterNotebookが動作する環境にある

VSCodeの拡張機能を入れる
「Jupyter」と「Python」を入れる

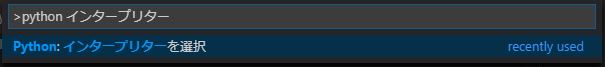
Pythonのインタプリタを選択
VSCodeで「F1」キーを押下し、「Python インタープリターを選択」から使用するPythonのバージョンを選択
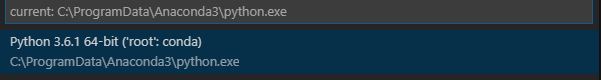
自分は、pythonの拡張機能を入れたときに、右下に警告が出たのでそちらから設定した。
動作確認
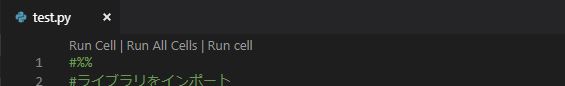
下記コード「test.py」を作成
#%%
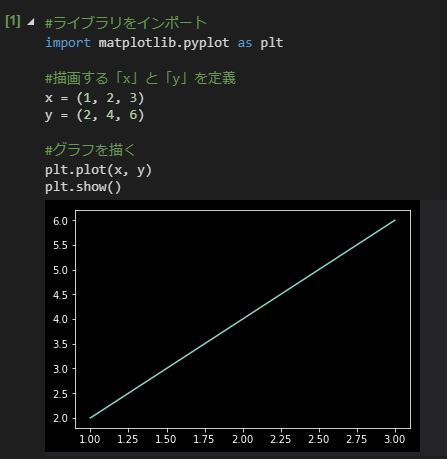
#ライブラリをインポート
import matplotlib.pyplot as plt
#描画する「x」と「y」を定義
x = (1, 2, 3)
y = (2, 4, 6)
#グラフを描く
plt.plot(x, y)
plt.show()「#%%」がセルの区切りを意味するらしい。
この上に「Run Cell」が表示されるのでクリックする。
実行された。
※うまく動かないときは、裏側でJupyter Qt Consoleを立ち上げると動くかも。